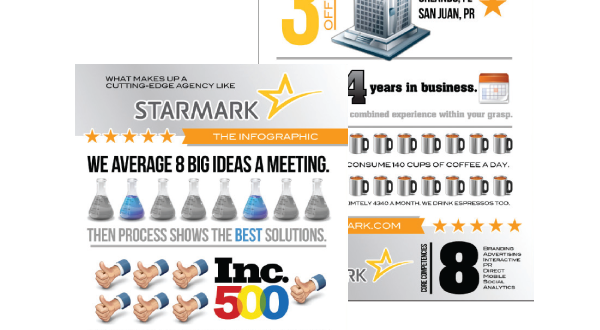
ETIP #88
Why ‘Infographics’ are a Great Business Tool!

Founded in 1982 the daily newspaper USA Today differentiated itself from its competitors by becoming more colorful, illustrative and photographic-rich. Much of what they did was construct illustrations that consolidated content into a quick, interesting image. This in turn not only stood out but also put the onus on other suppliers of data to treat content in a more engaging way.
Infographics have been around us even longer under the term data visualization. Here is one of the earliest known examples from 1863 of Napoleon’s March to Moscow.
The Wiki also tells us, “To convey ideas effectively, both aesthetic form and functionality need to go hand in hand, providing insights into a rather sparse and complex data set by communicating its key-aspects in a more intuitive way.” That’s what makes infographics an effective tool for marketers. As graphic representations tied to data, the intent is to take a lot of potentially boring and complex information and make it educational and visually appealing.
While charts, clipart, spreadsheets and boring PowerPoint presentations plague the business world, we believe that if you create visuals appropriate for your demographic, infographics have their place.
An additional positive about infographics is their ability to be a fabulous “link bait” strategy for your SEO efforts. While “link bait” strategies are worthy of their own posts, baiting your readership with visually-rich resources like infographics is a great start.
Most of today’s modern infographics are completely standalone; this eliminates lengthy written content to support the visual data. And infographics are not limited to complex data or heavily math-based statistical information much like the data visualization species of the past. Infographics are being used in education, innovation, training and in every conceivable way to make the complex interesting and digestible.
Here are some great example websites for you:
